About Systematic Reviews
How to Do a PRISMA
Flow Diagram


Automate every stage of your literature review to produce evidence-based research faster and more accurately.
PRISMA is well-known for greatly improving the transparency and the scientific merit of reported systematic reviews or meta-analysis. The PRISMA statement for reporting systematic reviews is one of the most recognized research tools, incorporating a 27-item checklist and a 4-phase flow diagram.
What Is a PRISMA Flow Diagram?
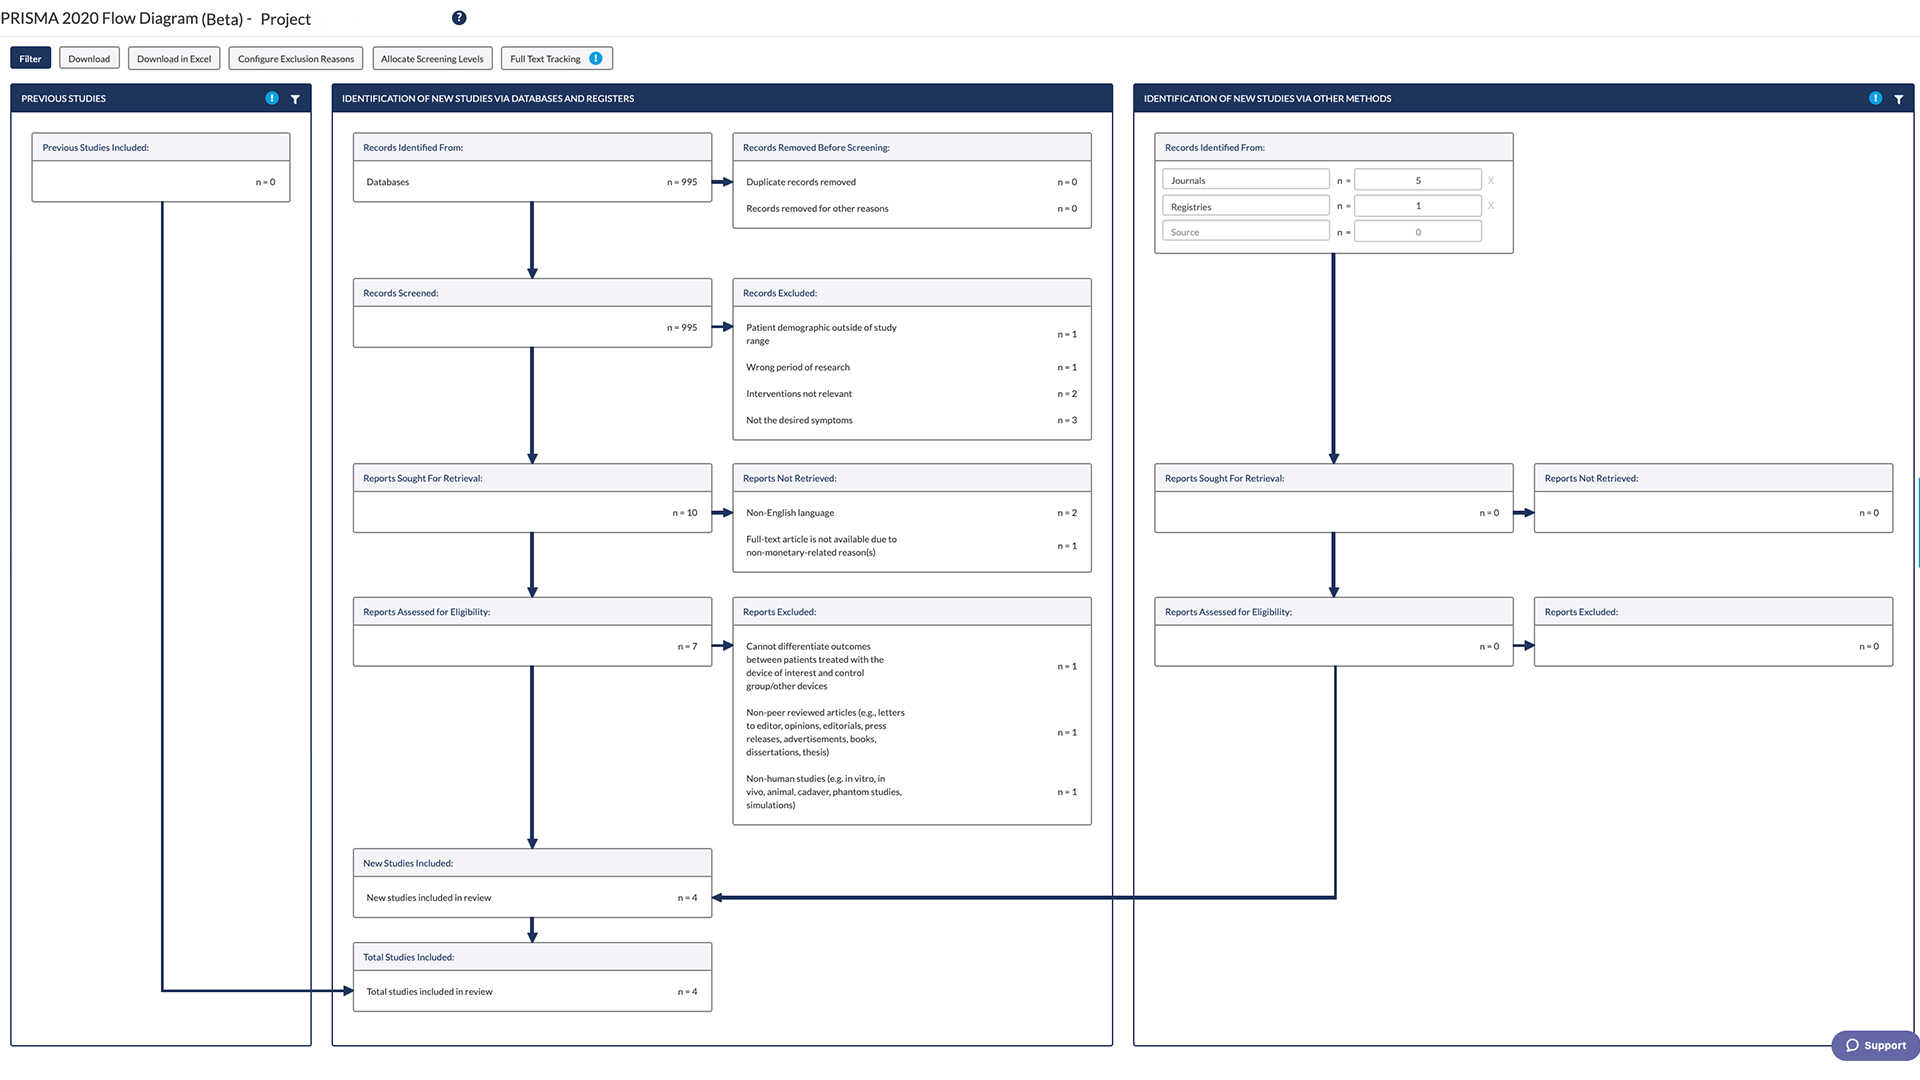
The PRISMA flow diagram (sometimes called a PRISMA flowchart) is typically the first figure in the results section of your systematic review. The flowchart visually represents the reviewers’ process for locating published data on the subject and how they chose what to include in the review.
These diagrams are important in systematic reviews because they help researchers demonstrate the quality of the review, allow the readers to assess the strengths and weaknesses of the research, and permit replication of review methods. So, how do you create a PRISMA flow diagram?
How to Create a PRISMA Flow Diagram
When creating a PRISMA flow diagram, you will need to understand how the 4 phases are contained in one process. The 4 phases are:
1. Identification
This first phase involves identifying the articles for review. First, using your search strategy, search all databases through the abstract and citation databases you selected (e.g., PubMed, Scopus). Input the search results into one citation management program like Paperpile, Zotero, Microsoft Excel, or Google Sheets. Note the number of citations from the search results.
If you use multiple databases, you should know that they have specific guidelines on how to search for keywords and how to combine keywords for an effective search. This means you may need to apply different guidelines for effective results in each database.
Next, you will need to remove duplicate records. You can do this on the citation management program you used. Separately note the number of unique citations after removing duplicate records.
2. Screening
Screening an article for review involves determining whether the article contains material that would be relevant or helpful for a researcher’s systematic review. This is a simple “yes” or “no” choice. Articles labeled “yes” will be pulled for systematic review, while “no” means that an article should be excluded. The investigators must read the title and abstract of each record and determine whether it should be included or excluded.
Investigators must also note the reason for exclusion. There are different reasons for exclusion – the most common are, “no control group,” “no original data,” “not relevant to the research,” “opinion piece,” and “wrong population or intervention.” You can use different colors for different exclusion reasons. Record the number of articles excluded (citations with red tag), as well as the number of articles under each reason for exclusion based on this screening process.
If there is disagreement on whether an article should be excluded, it should be resolved by discussion or by asking another investigator to read the article and make a decision. Be sure to check our PRISMA Guidelines for Systematic review for more information.
3. Eligibility
The third phase involves determining the studies’ eligibility. This phase helps you determine whether the articles left would help you to answer your research question. You determine the eligibility by reviewing the full text of the articles remaining after the title and abstract screening.
Two investigators read the full text of all articles and then make an “include” or “exclude” decision. If there are disagreements, they should be resolved using the same procedure as in screening. Again, record the number of articles you exclude and the number of articles under each reason for exclusion.
4. Inclusion
The last phase includes finalizing the list of studies to include in the systematic review. In this phase, you decide how many of these studies can be included in a quantitative synthesis or a meta-analysis.
After excluding irrelevant studies in the full-text screen, you’ll know how many studies will be included in your systematic review. Note this number – it will also be used in your flow diagram.
Learn More About DistillerSR
(Article continues below)
Creating Your PRISMA Flow Diagram
All the numbers you noted in the 4 phases will be used to create your PRISMA flow diagram. You can use one of the many online PRISMA research tools to create a flowchart; some include an existing template you can use – all you need to do is input the figures recorded in each of the phases and allow the software to create your flow diagram. After inputting the figures, you can download your PRISMA flowchart in any file format of your choice.


